Introduction to multi-channel images
A short introduction to RGB and remote sensing images.
About
In the previous post, we took a closer look at grayscale images and how they are encoded on the computer. But these types of images are boring... Images with color are nicer to look at and carry more information for us. In the following, we will examine RGB images and what the difference is between those images and multi-spectral images.
Short recap: Grayscale images
To summarize our findings from the previous post: We have seen that every image consists of pixels. These pixels are nothing more than numbers stored as binary values on the disk. Depending on how many bits we use per pixel, we can tune the number of distinct colors (color-depth). Besides adjusting the color-depth, we also tuned the resolution. With a higher resolution, we can show more details. Remember, with a single pixel, we can only encode a single color, but with many pixels, we can capture scenes and objects!
RGB images
So how do we add color information to our images? If we think back to art class, we may remember primary colors. Red, green, and blue can be combined to create any color. Because we work with displays and light emitting from them, we additively mix the primary colors.1 Each of these three colors has its own channel. In the previous grayscale examples, there was only a single channel for our gray values. Now we use three channels instead of one. These three channels are combined and presented to us in an additive manner. A close-up image of an LCD screen helps us to understand how we create colors on our screen.
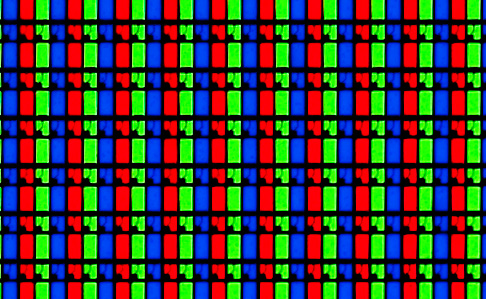
Our color values are once again only binary values on our disk. But if we show them on our LCD screen, each pixel has a red, green, and blue subpixel, which are combined to show us the color we want. Now let's start to program and see if we can mix some colors with Python!
import numpy as np
from PIL import Image, ImageOps

def to_rgb_image(x):
    return Image.fromarray(x, mode="RGB")

def upscale_image(img, img_width=224, img_height=224):
    return img.resize((img_width, img_height), resample=Image.NEAREST)

# Let's start with a single pixel but with three channels!
# Btw do not forget to set dtype, otherwise the colors will be wrong ;)
img_values = {
    "pixel_red": np.array([255, 0, 0], dtype=np.uint8).reshape(1, 1, 3),
    "pixel_green": np.array([0, 255, 0], dtype=np.uint8).reshape(1, 1, 3),
    "pixel_blue": np.array([0, 0, 255], dtype=np.uint8).reshape(1, 1, 3),
}

for name, value in img_values.items():
    img = to_rgb_image(value)
    img = upscale_image(img)
    bordered_img = ImageOps.expand(img, border=1, fill="black")



Now that we have the three primary colors, we can mix them to get almost any color! Here are some examples:
pixel_values = {
    "black": [0, 0, 0],
    "white": [255, 255, 255],
    "red_and_green": [255, 255, 0],
    "green_and_blue": [0, 255, 255],
    "all_150": [150, 150, 150],
}

for name, p_val in pixel_values.items():
    img = to_rgb_image(
        np.array(p_val, dtype=np.uint8).reshape(1, 1, 3)
    )
    img = upscale_image(img)
    bordered_img = ImageOps.expand(img, border=1, fill="black")


You can also play around with the following widget to combine the red (r), green (g), and blue (b) color values to a single RGB color2:
If we don't limit ourselves to a single pixel, we can visualize vibrant images, showing us many different objects and scenes. With the extra color information, we can more easily differentiate objects, like flowers or fruits.
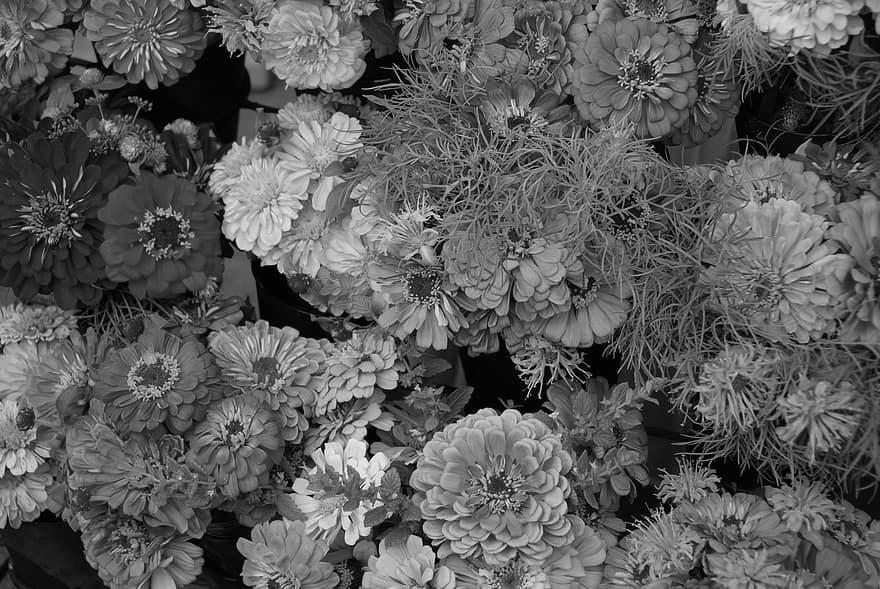
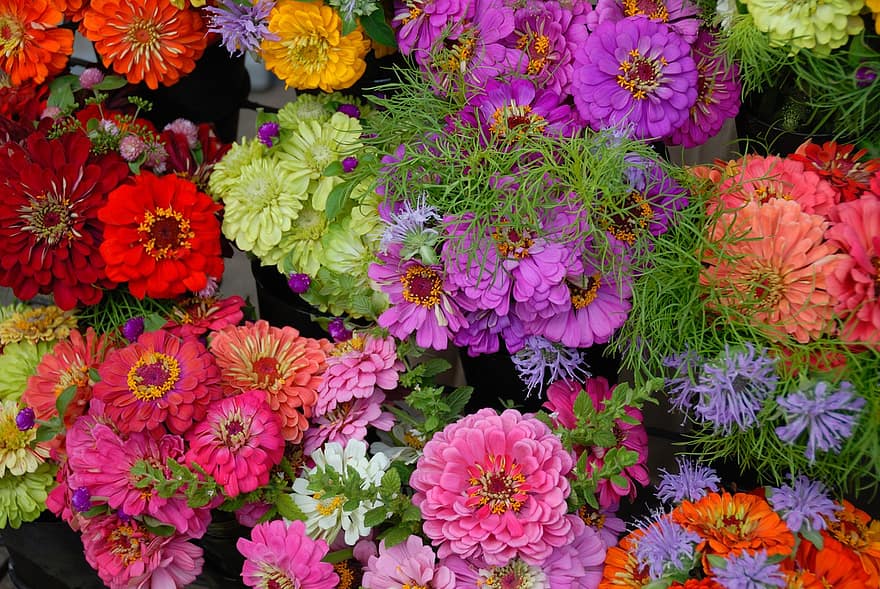
In the computer vision field, most architectures also work with RGB images. These are the types of images we usually use for everything. The extra color information helps machine learning researches to increase the accuracy of the predictions further. It seems reasonable for us humans to assume that color information improves the prediction performance because it is easier to identify objects if we add color to the image. But for the computer, these are once again nothing more than 0s and 1s. So what would happen if we add more channels?
Before we move on, let's summarize what we have learned so far.
Summary
To summarize the previous section: The LCD screens we are looking at combine red, green, and blue subpixels in each pixel to transform the binary values into colors. These three colors are used because they are primary colors and can be additively combined to create any color. On disk, these values are still nothing more than binary numbers. But now we have three channels and, therefore, three times as many bytes per image compared to a grayscale image. For a 28 x 28 pixels image, we now have 28 x 28 x 3 x color-depth bytes. The extra color information helps us (and neural networks) to identify and differentiate objects.
Introduction to remote sensing images
In the previous section, we saw how different a grayscale image looks from an RGB image and that it is easier for us to identify and differentiate colored objects. The same holds for neural networks! In the computer vision setting, images are used as input, and the network takes some action based on it. For example, we could use it to predict a specific class (dog or cat) or transform the picture (remove people from the scenery). But what would happen if we add more channels? Would the prediction performance still increase?
In a field called remote sensing we sometimes use multi-spectral images as input images. After Wikipedia, remote sensing is:
In current usage, the term "remote sensing" generally refers to the use of satellite or aircraft-based sensor technologies to detect and classify objects on Earth.
So the images used in remote sensing could be classic RGB images from drones used to classify different objects. Here the classes could be building, car, forest, water, fields, etc. With the introduction of Deep Learning and neural networks in the field, the processing of a different image type is gaining popularity:multi-spectral images. To answer what multi-spectral images are, let's take a step back and think about how our RGB images are displayed on an LCD screen. We know that each pixel uses subpixels to add them together to a color. The subpixel shines in a single color. More accurately, the subpixel emits electromagnetic waves in a specific wavelength in the spectrum of visible light. Here, visible refers to a spectrum we humans can perceive.
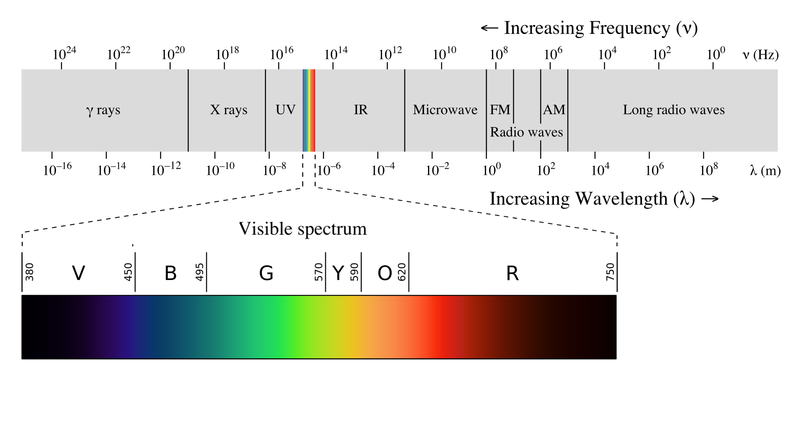
A blue subpixel mostly emits an electromagnetic wave with a wavelength of around 470nm, which we perceive as blue. That means that the LCD screen does not add the different wavelengths together in some way, it only drives the subpixels differently, and for our eyes, it seems like the light of the subpixels have been combined to a specific color. As we have seen previously, if we zoom in on an LCD screen, we can differentiate the subpixels' primary colors again.
If our LCD screen would only emit electromagnetic waves outside of the visible spectrum, it would be of little benefit to us humans. But visualizing bands that we aren't able to see is quite helpful! A well-known use case is thermal imaging. Here the long-infrared band is detected or sensed and visualized. The long-infrared band shows us the temperature variations, even if the objects aren't visible to us. The following figure shows us an example.


If we look at both the RGB and infrared images, we can combine them to get even more information! The combination would count as a multi-spectral image. We do not limit ourselves to three visible light bands and can gain even more insights. What bands are sensed depends on the given sensor and the desired use-case. For example, the Sentinel-2 satellite takes multi-spectral images with 13 bands in the visible, near-infrared, and short wave infrared part of the spectrum. The next post will take a closer look at how we can load and visualize these remote images. But, before we move on, let's summarize what we have learned so far.
Summary
We went from grayscale images with a single channel, to RGB images with three channels, to multi-spectral images with more than three channels. These multi-spectral images do not only focus on the visual-spectrum of electromagnetic waves but use even more bands. The main idea is that the information from different bands allows us to learn more about the object or scene. In our previous example, we were able to verify that the person had five fingers on his left hand, even if we weren't able to see it from the visual-spectrum of the light. For my master thesis, I hope that this additional information can be used in multi-spectral remote sensing images to increase neural networks' accuracy and robustness further.
But before we dive deep into neural networks, we first need to understand how we can visualize and work with these multi-spectral images, which will be the goal of the next post.
Until then, have a productive time! ![]()
1. For a more detailed comparison of additive vs. subtractive colors, see the blog post from thepapermillstore.com↩
2. Sometimes the initialization of the widgets hang. The best solution I found was reopening the same page in Incognito Mode and reloading the page. It can take up to a minute until the widgets are loaded.↩